
NCERT Solutions | Class 6 Maths Chapter 9 | Data Handling

CBSE Solutions | Maths Class 6
Check the below NCERT Solutions for Class 6 Maths Chapter 9 Data Handling Pdf free download. NCERT Solutions Class 6 Maths were prepared based on the latest exam pattern. We have Provided Data Handling Class 6 Maths NCERT Solutions to help students understand the concept very well.
NCERT | Class 6 Maths
| Book: | National Council of Educational Research and Training (NCERT) |
|---|---|
| Board: | Central Board of Secondary Education (CBSE) |
| Class: | 6th |
| Subject: | Maths |
| Chapter: | 9 |
| Chapters Name: | Data Handling |
| Medium: | English |
Data Handling | Class 6 Maths | NCERT Books Solutions
You can refer to MCQ Questions for Class 6 Maths Chapter 9 Data Handling to revise the concepts in the syllabus effectively and improve your chances of securing high marks in your board exams.
NCERT Solutions for Class 6 Maths Chapter 9 Data Handling Exercise 9.1
Ex 9.1 Class 6 Maths Question 1.
In a Mathematics test, the following marks were obtained by 40 students. Arrange these marks in a table using tally marks.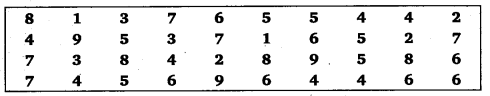
(a) Find how many students obtained marks equal to or more than 7?
(b) How many students obtained marks below 4?
Solution:
In the first column of the table, we write all the values of marks scored by the students starting from the lowest to the highest. In the second column, a vertical bar (|) called the tally mark is put against the number, whenever it occurs. For our convenience, we shall keep the tally marks in bunches of five, the fifth mark being drawn diagonally across the first four. We continue this process for all the values of the first column. Finally, we count the number of tally marks corresponding to each observation and write the number in the third column to represent the number of students.Thus, we have the table as under:

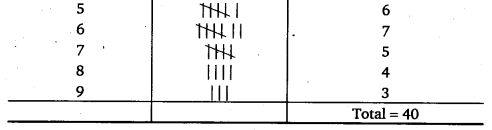
From the above, clearly the number of students who obtained marks equal to or more than 7 marks are
5 + 4+3=12
Clearly, from the above table the number of students scoring marks below 4 are
2 + 3 + 3 = 8
Ex 9.1 Class 6 Maths Question 2.
Following is the choice of sweets of 30 students of class VI. Ladoo, Barfi, Ladoo, Jalebi, Ladoo, Rasgulla, Jalebi, Ladoo, Barfi, Rasgulla, Ladoo, Jalebi, Jalebi, Rasgulla, Ladoo, Rasgulla, Jalebi, Ladoo, Rasgulla, Ladoo, Ladoo, Barfi, Rasgulla, Rasgulla, Jalebi, Rasgulla, Ladoo, Rasgulla, Jalebi, Ladoo.(a) Arrange the names of sweets in a table using tally marks.
(b) Which sweet is preferred by most of the students?
Solution:
(a) The required table is as under: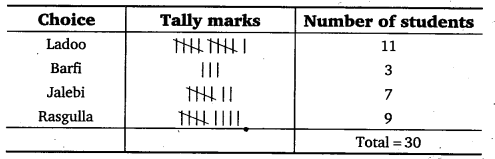
(b) The sweet Ladoo is preferred by the most of the students.
NCERT Solutions for Class 6 Maths Chapter 9 Data Handling Exercise 9.2
Ex 9.2 Class 6 Maths Question 1.
Total number of animals in five villages are as follows:Village A : 80
Village B : 120
Village C : 90
Village D : 40
Village E : 60
Prepare a pictograph of these animals using one symbol
(a) How many symbols represent animals of village E?
(b) Which village has the maximum number of animals?
(c) Which village has more animals: village A or village C?
Solution:
The given data can be represented by a pictograph as given below: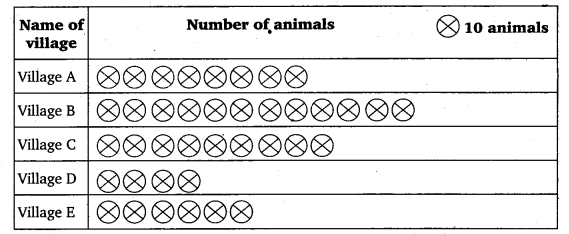
(i) 6 symbols represent the animals of village E.
(ii) Village B has the maximum number of animals.
(iii) Village C has more animals than that of village A.
Ex 9.2 Class 6 Maths Question 2.
Total number of students of a school in different years is shown in the following table: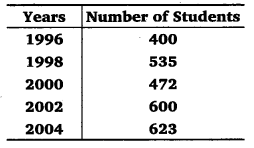
A. Prepare a pictograph of students using one symbol A to represent 100 students and answer the following questions:
(a) How many symbols represent total number of students in the year 2002?
(b) How many symbols represent total number of students for the year 1998?
B. Prepare another pictograph of students using any other symbol each representing 50 students. Which pictograph do you find more informative?
Solution:
The given data can be represented by a pictograph as given below: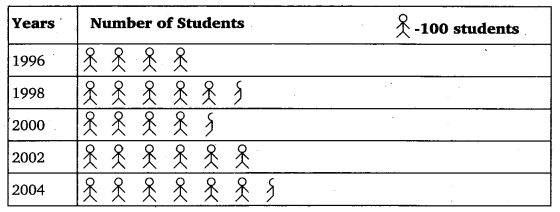
(a) 6 symbols represent total number of students in the year 2002.
(b) 5 complete symbols and one incomplete symbol of 35 students
B. Let us prepare another pictograph of students using symbol

Second pictograph is more informative as it is accurate.
NCERT Solutions for Class 6 Maths Chapter 9 Data Handling Exercise 9.3
Ex 9.3 Class 6 Maths Question 1.
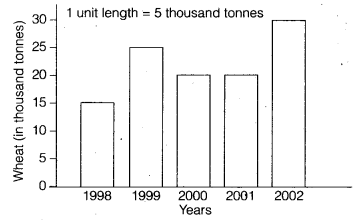
The bar graph given alongside shows the amount of wheat purchased by government during the year 1998-2002.Read the bar graph and write down your observations. In which year was.
(a) the wheat production maximum?
(b) the wheat production minimum?
Solution:
The given bar graph represents the amount of wheat (in thousand tonnes) purchased by government during the year 1998-2002. The amount of wheat purchased during 1998 – 2002 = 15 + 25 + 20 +20 +30 = 110 (in thousand tonnes).(a) The maximum wheat production was in the year 2002.
(b) The minimum wheat production was in the year. 1998.
Ex 9.3 Class 6 Maths Question 2.
Observe this bar graph which is showing the sale of shirts in a ready made shop from Monday to Saturday.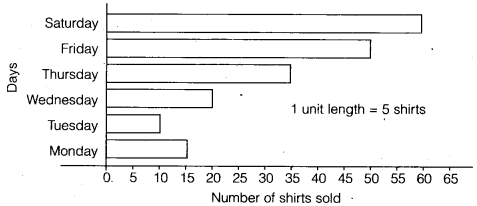
Now answer the following questions:
(a) What information does the above bar graph given?
(b) What is the scale chosen on the horizontal line representing number of shirts?
(c) On which day were the maximum number of shirts sold? How many shirts were sold on that day?
(d) On which day were the minimum number of shirts sold?
(e) How many shirts were sold on Thursday?
Solution:
(a) The given bar graph represents the number of shirts sold from Monday to Saturday.(b) Scale: 1 unit length = 5 shirts.
(c) Saturday and 60 in number.
(d) Tuesday.
(e) 35
Ex 9.3 Class 6 Maths Question 3.
Observe this bar graph which shows the marks obtained by Aziz in half yearly examination in different subjects.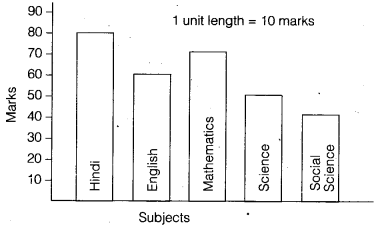
Answer the given questionsn.
(a) What information does the bar graph give?
(b) Name the subject in which Aziz scored maximum marks.
(c) Name the subject in which he has scored minimum marks.
(d) State the names of the subjects and marks obtained in each of them.
Solution:
(a) The given bar graph represents the marks obtained by Aziz in half yearly examination in different subjects.(b) Hindi
(c) Social Studies.
(d) Hindi-80, English-60, Mathematics-70, Science-50 and Social Studies-40.
NCERT Solutions for Class 6 Maths Chapter 9 Data Handling Exercise 9.4
Ex 9.4 Class 6 Maths Question 1.
A survey of 120 school students was done to find which activity they prefer to do in their free time:
Draw a bar graph to illustrate the above data taking scale of 1 unit length = 5 students.
Which activity is preferred by most of the students other than playing?
Solution:
Here, 5 values of the data are given. So, mark 5 points on the horizontal axis at equal distances and erect rectangles of the same width whose heights are proportional to the values of the numerical data.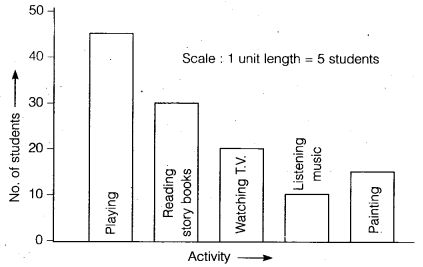
The activity of ‘reading story books’ is preferred by most of the students other than playing.
Ex 9.4 Class 6 Maths Question 2.
The number of Mathematics books sold by a shopkeeper on six consecutive days is shown below: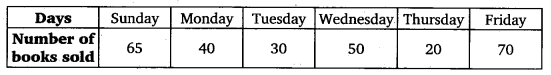
Draw a bar graph to represent the above information choosing the scale of your choicer
Solution:
Here 6 values of the data are given. So, mark 6 points on the horizontal axis at equal distances and erect rectangles of the same width whose heights are proportional to the values of the numerical data.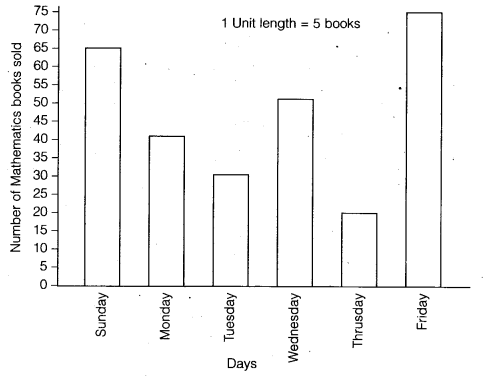
Ex 9.4 Class 6 Maths Question 3.
Following table shows the number of bicycles manufactured in a factory during the years 1998 to 2002. Illustrate this data using a bar graph. Choose a scale of your choice.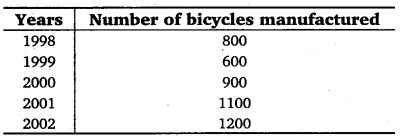
(a) In which year were the maximum number of bicycles manufactured?
(b) In which year were the minimum number of bicycles manufactured.
Solution:
Here, 5 values of the data are given. So, mark 5 points on the horizontal axis at equal distances and erect rectangles of the same width whose heights are proportional to the values of the numerical data.
(a) The maximum number of bicycles were manufactured in the year 2002.
(b) The minimum number of bicycles were manufactured in the year 1999.
Ex 9.4 Class 6 Maths Question 4.
Number of persons in various age groups in a town is given in the following table.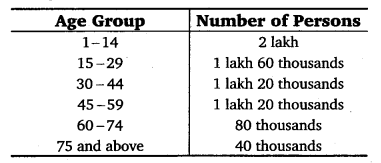
Draw a bar graph to represent , the above information and answer the following questions.
(take 1 unit length = 20 thousands)
(a) Which two age groups have same population?
(b) All persons in the’ age group of 60 and above are called senior citizens. How many senior citizens are there in the town?
Solution:
Here, 6 values of the data are given. So, mark 6 points on the horizontal axis at equal distances and erect rectangles of the same width whose heights are as under:Age Group
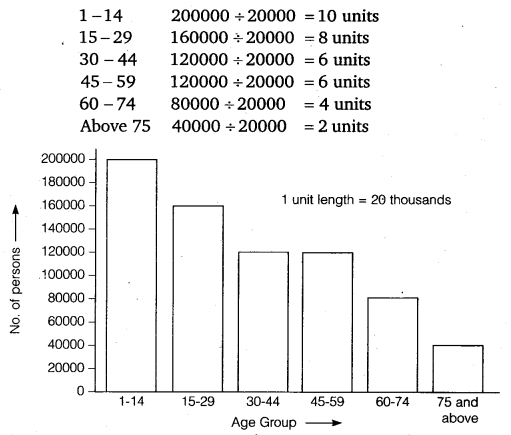
(a) Age groups 30 – 44 and 45 – 59 have the same population.
(b) Number of senior citizens are 80000 + 40000 = 120000.
NCERT Class 6 Maths
Class 6 Maths Chapters | Maths Class 6 Chapter 9
NCERT Solutions for Class 6 Maths
NCERT Solutions of Maths Class 6 Chapter-wise
Chapter-wise NCERT Solutions for Class 6 Maths
-
NCERT Solutions For Class 6 Maths Chapter 1 Knowing Our Numbers
NCERT Solutions For Class 6 Maths Chapter 2 Whole Numbers
NCERT Solutions For Class 6 Maths Chapter 3 Playing With Numbers
NCERT Solutions For Class 6 Maths Chapter 4 Basic Geometrical Ideas
NCERT Solutions For Class 6 Maths Chapter 5 Understanding Elementary Shape
NCERT Solutions For Class 6 Maths Chapter 6 Integers
NCERT Solutions For Class 6 Maths Chapter 7 Fractions
NCERT Solutions For Class 6 Maths Chapter 8 Decimals
NCERT Solutions For Class 6 Maths Chapter 9 Data Handling
NCERT Solutions For Class 6 Maths Chapter 10 Mensuration
NCERT Solutions For Class 6 Maths Chapter 11 Algebra
NCERT Solutions For Class 6 Maths Chapter 12 Ratio and Proportion
NCERT Solutions For Class 6 Maths Chapter 13 Symmetry
NCERT Solutions For Class 6 Maths Chapter 14 Practical Geometry
NCERT Solutions for Class 6 to 12
-
NCERT Solutions for Class 6 All Subjects
NCERT Solutions for Class 7 All Subjects
NCERT Solutions for Class 8 All Subjects
NCERT Solutions for Class 9 All Subjects
NCERT Solutions for Class 10 All Subjects
NCERT Solutions for Class 11 All Subjects
NCERT Solutions for Class 12 All Subjects
Post a Comment
इस पेज / वेबसाइट की त्रुटियों / गलतियों को यहाँ दर्ज कीजिये
(Errors/mistakes on this page/website enter here)