
NCERT Solutions | Class 8 Maths Chapter 5 | Data Handling

CBSE Solutions | Maths Class 8
Check the below NCERT Solutions for Class 8 Maths Chapter 5 Data Handling Pdf free download. NCERT Solutions Class 8 Maths were prepared based on the latest exam pattern. We have Provided Data Handling Class 8 Maths NCERT Solutions to help students understand the concept very well.
NCERT | Class 8 Maths
| Book: | National Council of Educational Research and Training (NCERT) |
|---|---|
| Board: | Central Board of Secondary Education (CBSE) |
| Class: | 8th |
| Subject: | Maths |
| Chapter: | 5 |
| Chapters Name: | Data Handling |
| Medium: | English |
Data Handling | Class 8 Maths | NCERT Books Solutions
NCERT Solutions for Class 8 Maths Chapter 5 Data Handling Exercise 5.1
Ex 5.1 Class 8 Maths Question 1.
For which of these would you use a histogram to show the data?(a) The number of letters for different areas in a postman’s bag.
(b) The height of competitors in an athletics meet.
(c) The number of cassettes produced by 5 companies.
(d) The number of passengers boarding trains from 7:00 a.m. to 7:00 pan. at a station.
Give reasons for each.
Solution:
In (b) and (d), data can be divided into class intervals. So, their histograms can be drawn.Ex 5.1 Class 8 Maths Question 2.
The shoppers who come to a departmental store are marked as: man (M), woman (W), boy (B) or Girl (G). The following list gives the shoppers who came during the first hour in the morning. W W W G B W W M G G M M W W W W G B M W B G G M W W M M W W W M W B W G M W W W W G W M M W W M W G W M G W M M B G G WMake a frequency distribution table using tally marks. Draw a bar graph to illustrate it.
Solution:
We arrange the data in a table using tally marks as :
Ex 5.1 Class 8 Maths Question 3.
The weekly wages (in ?) of 30 workers in a factory are :830, 835, 890, 810, 835, 836, 869, 845, 898, 890, 820, 860, 832, 833, 855, 845, 804, 808, 812, 840, 885, 835, 835, 836, 878, 840, 868, 890, 806,840.
Using tally marks make a frequency table with intervals as 800-810, 810-820 and so on.
Solution:
Let us make a grouped frequency table as under :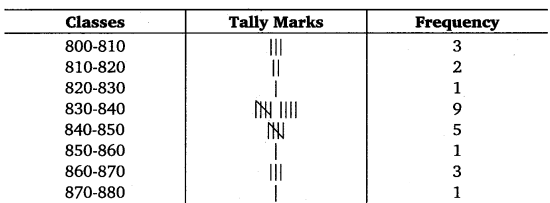
Ex 5.1 Class 8 Maths Question 4.
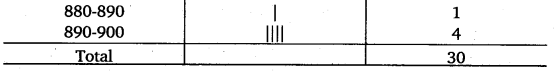
Draw a histogram for the frequency table made for the data in question 3, and answer the following questions.(i) Which group has the maximum number of workers?
(ii) How many workers earn? 850 and more?
(iii) How many workers earn less than? 850?
Solution:
The histogram to the data of question 3 is as :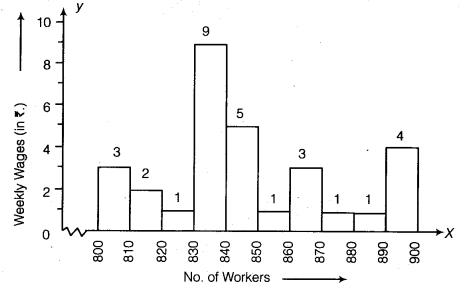
From the above histogram, clearly,
(i) The group 830-840 has the maximum number of workers.
(ii) The number of workers who earn ₹ 850 and more are 1 + 3 + 1 + 1 + 4, i.e., 10.
(iii) The number of workers who earn less than ₹ 850 are 3 + 2 + 1 + 9 + 5, i.e., 20.
Ex 5.1 Class 8 Maths Question 5.

The number of hours for which students of a particular class watched television during holidays is shown through the given graph (on previous page).
Answer the following:
(i) For how many hours did the maximum number of students watch TV?
(ii) How many students watched TV for less than 4 hours?
(iii) How many students spend more than 5 hours in watching TV?
Solution:
Clearly from the given histogram, we find that(i) The maximum number of students watch TV for 4 – 5 hours.
(ii) The number of students who watch TV for less than 4 hours are 4 + 8 + 22 = 34.
(iii) The number of students who spend more than 5 hours in watching TV are 8 + 6 = 14.
NCERT Solutions for Class 8 Maths Chapter 5 Data Handling Exercise 5.2
Ex 5.2 Class 8 Maths Question 1.
A survey was made to find the type of music that a certain group of young people liked in a city. Following pie chart shows the findings of this survey.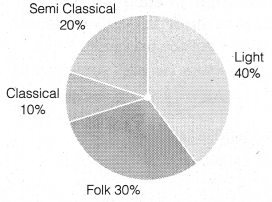
From this pie chart answer the following:
(i) If 20 people liked classical music, how many young people were surveyed?
(ii) Which type of music is liked by the maximum number of people?
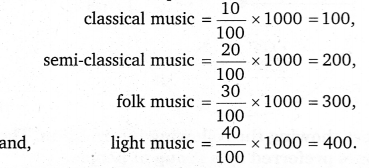
(iii) If a cassette company were to make 1000 CD’s, how many of each type would they make?
Solution:
(i) Let x be the number of young people surveyed.∴ 10% of x = 20
⇒ \frac { 10 }{ 100 } x x = 20
⇒ x = 20 x 10 = 200
Thus, number of young people surveyed = 200
(ii) Light music is liked by the maximum number of people.
(iii) Number of CD’s in respect of
Ex 5.2 Class 8 Maths Question 2.
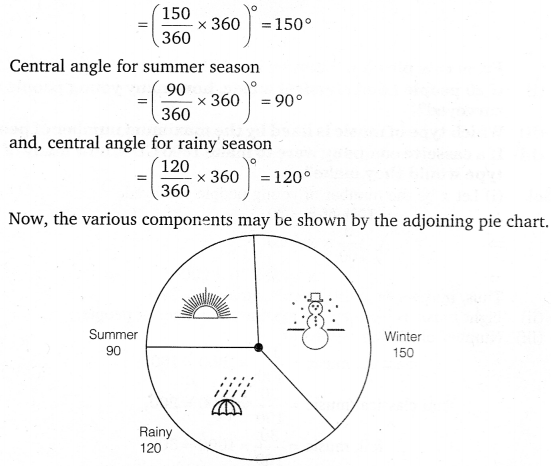
A group of 360 people were asked to vote for their favourite season from the three seasons rainy, winter and summer.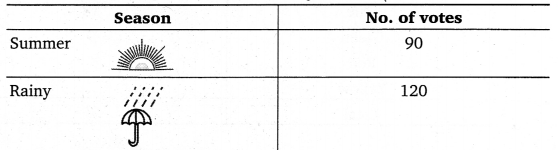
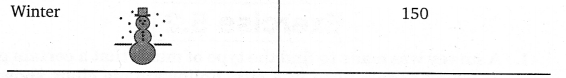
(i) Which season got the most votes?
(ii) Find the central angle of each sector.
(iii) Draw a pie chart to show this information.
Solution:
(i) The winter season got the maximum votes.(ii) The proportion of sectors (winter, summer and rainy seasons) are as
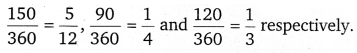
(iii) Central angle for winter season
Ex 5.2 Class 8 Maths Question 3.
Draw a pie chart showing the following information. The table shows the colours preferred by a group of people.
Find the proportion of each sector. For example. Blue is \frac { 18 }{ 36 } =\frac { 1 }{ 2 } ; Green is \frac { 9 }{ 36 } =\frac { 1 }{ 4 } and so on.
Use this to find the corresponding angles.
Solution:
Central angle for the blue colour=\left( \frac { 18 }{ 36 } \times 360 \right) ^{ \circ }=180^{ \circ },
Central angle for the green colour
=\left( \frac { 9 }{ 36 } \times 360 \right) ^{ \circ }=90^{ \circ },
Central angle for the red colour
=\left( \frac { 6 }{ 36 } \times 360 \right) ^{ \circ }=60^{ \circ },
central angle for the yellow colour
=\left( \frac { 3 }{ 36 } \times 360 \right) ^{ \circ }=30^{ \circ },
Now, various components may be shown by the adjoining pie chart.

Ex 5.2 Class 8 Maths Question 4.
The adjoining pie chart gives the marks scored in an examination by a student in Hindi, English, Mathematics, Social Science and Science. If the total marks obtained by the students were 540, answer the following questions.
(i) In which subject did the student score 105 marks?
(ii) How many more marks were obtained by the student in Mathematics than in Hindi?
(iii) Examine whether the sum of the marks obtained in Social Science and Mathematics is more than that in Science and Hindi.
Solution:
(i) For 540 marks, the central angle = 360°∴ For 1 mark, the central angle = \left( \frac { 360 }{ 540 } \right) ^{ \circ }=\left( \frac { 2 }{ 3 } \right) ^{ \circ }
∴ For 105 marks, the central angle = \left( \frac { 2 }{ 3 } \times 105 \right) ^{ \circ }=70^{ \circ }
Hence, from the given pie chart, the subject is Hindi.
(ii) Difference between the central angles made by the subject of Mathematics and Hindi = 90° – 70° = 20°.
For the central angle of 360°, marks obtained = 540
For the central angle of 1°, marks obtained =\frac { 540 }{ 360 } =\frac { 3 }{ 2 }
For the central angle of 20°, marks obtained =\frac { 3 }{ 2 } \times 20=30
Hence, 30 more marks were obtained by the student in Mathematics than Hindi.
(iii) Sum of the central angles made by Social Science and Mathematics = 65°+ 90° = 155°.
And, the sum of the central angles made by Science and Hindi = 80°+ 70° = 150°.
Since 155° >150°, therefore, the sum of the marks obtained in Social Science and Mathematics is more than that in Science and Hindi.
Ex 5.2 Class 8 Maths Question 5.
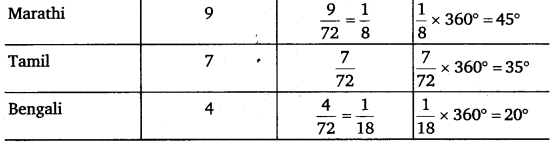
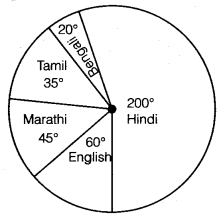
The number of students in a hostel, speaking different languages is given below. Display the data in a pie chart.
Solution:
Let us find the central angle of each sector. Here the total scale = 72. We thus have the following table :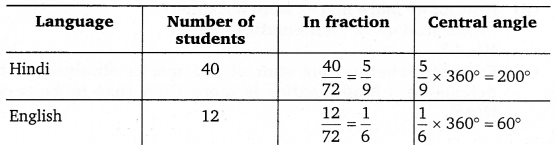
Now, we make the pie chart as shown below :
NCERT Solutions for Class 8 Maths Chapter 5 Data Handling Exercise 5.3
Ex 5.3 Class 8 Maths Question 1.
List the outcomes you can see in these experiments.
(a) Spinning a wheel,
(b) Tossing two coins together.
Solution:
(a) List of outcomes of spinning the given wheel are A, B, C and D.(b) When two coins are tossed together, the possible outcomes of the experiment are HH, HT, TH and TT.
Ex 5.3 Class 8 Maths Question 2.
When a die is thrown, list the outcomes of an event of getting(i)
(a) a prime number,
(b) not a prime number.
(ii)
(a) a number greater than 5,
(b) a number not greater than 5.
Solution:
(i) In a throw of die, list of the outcomes of an event of getting(a) a prime number are 2, 3 and 5.
(b) not a prime number are 1, 4 and 6. .
(ii) In a throw of die, list of the outcomes of an event of getting
(a) a number greater than 5 is 6.
(b) a number not greater than 5 are 1, 2, 3 and 4.
Ex 5.3 Class 8 Maths Question 3.
Find the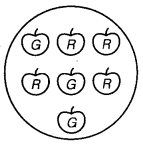
(a) Probability of the pointer stopping on D in (Question 1 (a)).
(b) Probability of getting an ace from a well shuffled deck of 52 playing cards.
(c) Probability of getting a red apple (see adjoining figure).
Solution:
(a) Out of 5 sectors, the pointer can stop dt any of sectors in 5 ways.∴ Total number of elementary events = 5. There is only one ‘D’ on the spinning wheel.
∴ Favourable number of outcomes = 1
∴ Required probability = \frac { 1 }{ 5 }
(b) Out of 52 cards, one card can be drawn in 52 ways.
∴ Total number of outcomes = 52
There are 4 aces in a pack of 52 cards, out of which one ace can be drawn in 4 ways.
∴ Favourable number of cases = 4
So, the required probability = \frac { 4 }{ 52 } =\frac { 1 }{ 13 }
(c) Out of 7 apples, one apple can be drawn in 7 ways.
∴ Total number of outcomes = 7
There are 4 red apples, in a bag of 7 apples, out of which 1 red apple can be drawn in 4 ways.
∴ Favourable number of case = 4
So, the required probability = \frac { 4 }{ 7 }
Ex 5.3 Class 8 Maths Question 4.
Numbers 1 to 10 are written on ten separate slips (one number on one slip), kept in a box and mixed well. One slip is chosen from the box without looking into it. What is the probability of(i) getting a number 6?
(ii) getting a number less than 6?
(iii) getting a number greater than 6?
(iv) getting a 1-digit number?
Solution:
Out of 10 slips, 1 slip can be drawn in 10 ways. So, the total number of outcomes = 10(i) An event of getting a number 6, i. e., if we obtain a slip having number 6 as an outcome.
So, favourable number of outcomes = 1
∴ Required probability = \frac { 1 }{ 10 }
(ii) An event of getting a number less than 6, i. e., if we obtain a slip having any of numbers 1, 2, 3, 4, 5 as an outcome.
So, favourable number of cases = 5
∴ Required probability = \frac { 5 }{ 10 } =\frac { 1 }{ 2 }
(iii) An event of getting a number greater than 6, i.e., if we obtain a slip having any of numbers 7, 8, 9, 10 as an outcome.
So, favourable number of cases = 4
∴ Required probability = \frac { 4 }{ 10 } =\frac { 2 }{ 5 }
(iv) An event of getting a one-digit number, i.e., if we obtain a slip having any of numbers 1, 2, 3, 4, 5, 6, 7, 8, 9 as an outcome.
So, favourable number of cases = 9
∴ Required probability =\frac { 9 }{ 10 }
Ex 5.3 Class 8 Maths Question 5.
If you have a spinning wheel with 3 green sectors, 1 blue sector and 1 red sector, what is the probability of getting a green sector? What is the probability of getting a non-blue sector?Solution:
Out of 5 sectors, the pointer can stop at any of sectors in 5 ways.∴ Total number of outcomes = 5
There are 3 green sectors in the spinning wheel, out of which one can be obtained in 3 ways.
∴ Favourable number of outcomes = 3
So, the required probability = \frac { 3 }{ 5 }
Further, there are 4 non-blue sectors in the spinning wheel, out of which one can be obtained in 4 ways.
So, the required probability = \frac { 4 }{ 5 }
Ex 5.3 Class 8 Maths Question 6.
Find the probabilities of the events given in Question 2.Solution:
In a single throw of a die, we can get any one of the six numbers 1, 2, 6 marked on its six faces.Therefore, the total number of outcomes = 6
(i) Let A denote the event “getting a prime number”. Clearly, event A occurs if we obtain 2, 3, 5 as an outcome.
∴ Favourable number of outcomes = 3
Hence, P\left( A \right) =\frac { 3 }{ 6 } =\frac { 1 }{ 2 }
(ii) Let A denote the event “not getting a prime number”. Clearly, event A occurs if we obtain 1, 4, 6 as an outcome.
∴ Favourable number of outcomes = 3
Hence, P\left( A \right) =\frac { 3 }{ 6 } =\frac { 1 }{ 2 }
(iii) The event “getting a number greater than 5” will occur if we obtain the number 6.
∴ Favourable number of outcomes = 1
Hence, required probability = \frac { 1}{ 6 }
(iv) The event “getting a number not greater than 5” will occur if we obtain one of the numbers 1, 2, 3, 4, 5.
∴ Favourable number of outcomes = 5
Hence, required probability = \frac { 5 }{ 6 }
NCERT Class 8 Maths
Class 8 Maths Chapters | Maths Class 8 Chapter 5
NCERT Solutions for Class 8 Maths
NCERT Solutions of Maths Class 8 Chapter-wise
Chapter-wise NCERT Solutions for Class 8 Maths
-
NCERT Solutions For Class 8 Maths Chapter 1 Rational Numbers
NCERT Solutions For Class 8 Maths Chapter 2 Linear Equations in One Variable
NCERT Solutions For Class 8 Maths Chapter 3 Understanding Quadrilaterals
NCERT Solutions For Class 8 Maths Chapter 4 Practical Geometry
NCERT Solutions For Class 8 Maths Chapter 5 Data Handling
NCERT Solutions For Class 8 Maths Chapter 6 Squares and Square Roots
NCERT Solutions For Class 8 Maths Chapter 7 Cubes and Cube Roots
NCERT Solutions For Class 8 Maths Chapter 8 Comparing Quantities
NCERT Solutions For Class 8 Maths Chapter 9 Algebraic Expressions and Identities
NCERT Solutions For Class 8 Maths Chapter 10 Visualising Solid Shapes
NCERT Solutions For Class 8 Maths Chapter 11 Mensuration
NCERT Solutions For Class 8 Maths Chapter 12 Exponents and Powers
NCERT Solutions For Class 8 Maths Chapter 13 Direct and Indirect proportions
NCERT Solutions For Class 8 Maths Chapter 14 Factorisation
NCERT Solutions For Class 8 Maths Chapter 15 Introduction to Graphs
NCERT Solutions For Class 8 Maths Chapter 16 Playing with Numbers
Post a Comment
इस पेज / वेबसाइट की त्रुटियों / गलतियों को यहाँ दर्ज कीजिये
(Errors/mistakes on this page/website enter here)