
NCERT Solutions | Class 11 Economics Statistics for Economics Chapter 6 | Measures of Dispersion

CBSE Solutions | Economics Class 11
Check the below NCERT Solutions for Class 11 Economics Statistics for Economics Chapter 6 Measures of Dispersion Pdf free download. NCERT Solutions Class 11 Economics were prepared based on the latest exam pattern. We have Provided Measures of Dispersion Class 11 Economics NCERT Solutions to help students understand the concept very well.
NCERT | Class 11 Economics Statistics for Economics
| Book: | National Council of Educational Research and Training (NCERT) |
|---|---|
| Board: | Central Board of Secondary Education (CBSE) |
| Class: | 11 |
| Subject: | Economics |
| Chapter: | 6 |
| Chapters Name: | Measures of Dispersion |
| Medium: | English |
Measures of Dispersion | Class 11 Economics | NCERT Books Solutions
Statistics for Economics Class 11 NCERT Solutions Chapter 6 Measures of Dispersion
Question 1.
Answer:
Dispersion is the extent to which values in a distribution differ from the avarage of the distribution. Knowledge of only average is insufficient as it does not reflect the quantum of variation in values.Measures of dispersion enhance the understanding of a distribution considerably by providing information about how much the actual value of items in a series deviate from the central value, e.g., per capita income gives only the average income but a measure of dispersion can tell you about income inequalities, thereby improving the understanding of the relative living standards of different sections of the society. Through value of dispersion one can better understand the distribution.
Thus a measure of dispersion is a good supplement to the central value in understanding a frequency distribution.
Question 2.
Answer:
Standard Deviation is considered to be the best measure of dispersion and is therefore the most widely used measure of dispersion.- It is based on all values and thus provides information about the complete series. Because of this reason, a change in even one value affects the value of standard deviation.
- It is independent of origin but not of scale.
- It is us’eful in advanced statistical calculations like comparison of variability in two data sets.
- It can be used in testing of hypothesis.
- It is capable of further algebraic treatment.
Question 3.
Answer:
Yes, it is true that some measures of dispersion depend upon the spread of values, whereas some calculate the variation of values from the central value. Range and Quartile Deviation measure the dispersion by calculating the spread within which the value lie. Mean Deviation and Standard Deviation calculate the extent to which the values differ from the average or the central value.Question 4.
Answer:
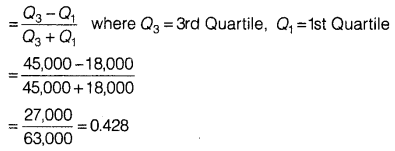
25% of the persons earned more than ₹ 45,000. This implies that upper quartile Q3 = 45,000 75% earned more than 18,000. This implies that lower quartile Q1 =18,000Absolute Measure of Dispersion = Q3 – Q1 = 45,000 – 18,000 = 27,000
Relative Measure of Dispersion
Co-efficient of Quartile Deviation
Question 5.
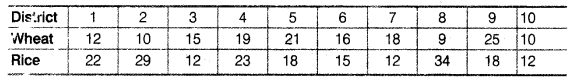
Calculate for each crop,
(i) Range
(ii) QD
(iii) Mean’Deviation about Mean
(iv) Mean Deviation about Median
(v) Standard Deviation
(vi) Which crop has greater variation?
(vii) Compare the value of different measures for each crop.
Answer:
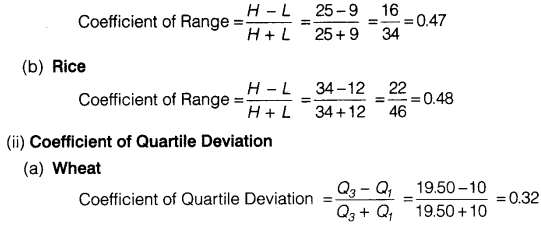
(i) Range(a) Wheat Highest value of distribution (H) = 25
Lowest value of distribution (L) = 9
Range = H – L = 25 – 9 = 16
(b) Rice Highest value of distribution (H) = 34
Lowest value of distribution (L)=12
Range = H – L = 34 – 12 = 22
(ii) Quartile Deviation
(a) Wheat Arranging the production of wheat in increasing order 9, 10, 10, 12, 15, 16, 18, 19, 21, 25
Q1 = \(\frac{N+1}{4}\)th item = \(\frac{10+1}{4}\)th item = \(\frac{11}{4}\)th item
= 2.75th item
= Size of 2nd item + 0.75 (size of 3rd item – size of 2nd item)
= 10 + 0.75(10 – 10)
= 10 + 0.75 × 0
= 10
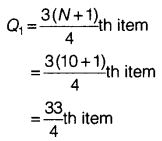
Q3 = \(\frac{3(N+1)}{4}\)th item = \(\frac{3(10+1)}{4}\)th item
= \(\frac{33}{4}\)th item = 8.25th
= Size of 8th item + 0.25 (size of 9th item – size of 8th item)
= 19 + 0.25(21 – 19)
= 19 + 0.25 × 2
= 19 + 0.50 = 19.50
Quartile Deviation = \(\frac{Q_{3}-Q_{1}}{2}=\frac{19.50-10}{2}=\frac{9.50}{2}\) = 4.75
(b) Rice Arranging the data of production of rice
12, 12, 12, 15, 18, 18, 22, 23, 29, 34 item
Q1 = \(\frac{N+1}{4}\)th item = \(\frac{10+1}{4}\)th item
= 2.75 th item
= Size of 2nd item + 0.75 (size of 3rd item – size of 2nd item)
= 12 + 0.75(12 – 12) = 12 + 0.75 × 0
= 12
= 8.25th item
= Size of 8th item + 0.25 (size of 9th item – size of 8th item)
= 23 + 0.25(29 – 23)
= 23 + 0.25 × 6
= 23 + 1.5
= 24.5
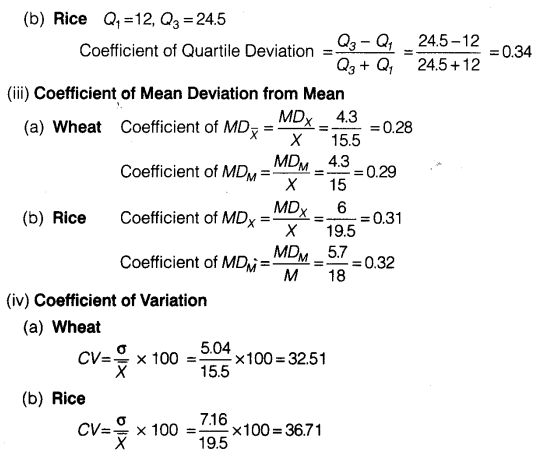
Quartile Deviation = \(\frac{Q_{3}-Q_{1}}{2}=\frac{24.5-12}{2}=\frac{12.50}{2}\) = 6.25
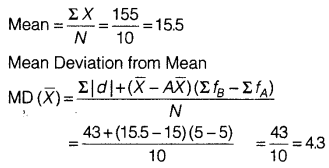
(iii) Mean Deviation about Mean
(a) Wheat

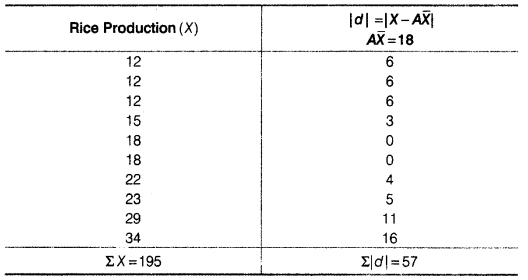
(b) Rice
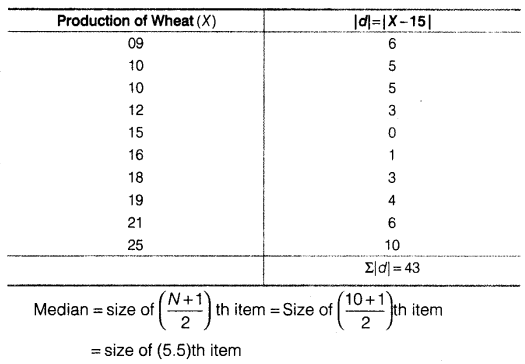
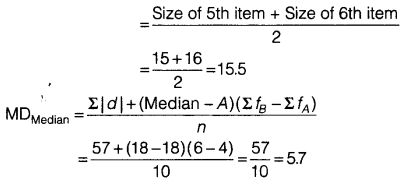
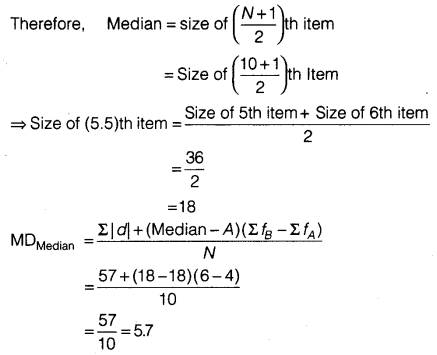
(iv) Mean Deviation about Median
(a) Wheat
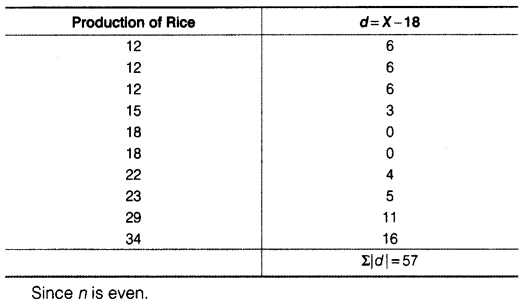
(b) Rice
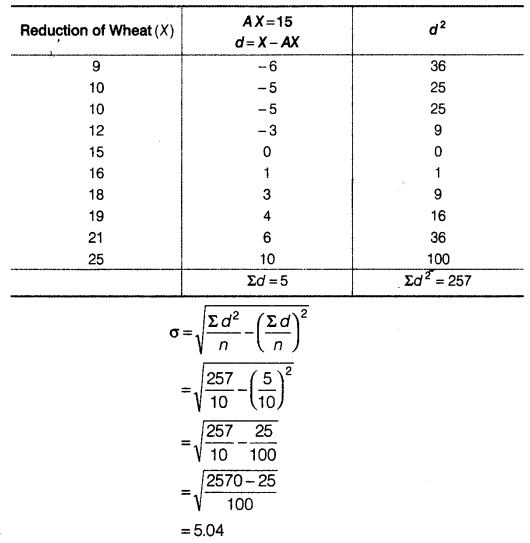
(v) Standard Deviation
(a) Wheat
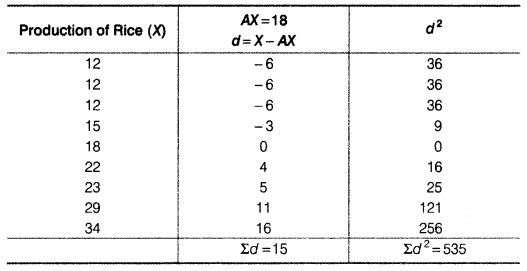
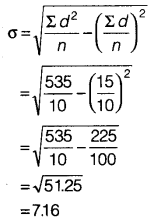
(b) Rice
(vi) Coefficient of Variation
(a) Wheat
CV =\(\frac{\sigma}{\overline{X}} \times 100=\frac{5.04}{15.5} \times 100\) = 32.51
(b) Rice
CV =\(\frac{\sigma}{X} \times 100=\frac{7.16}{19.5} \times 100\) = 36.71
Rice crop has greater variation as the coefficient of variation is higher for rice as compared to that of wheat.
(vii) Rice crop has higher Range, Quartile Deviation, Mean Deviation about Mean, Mean Deviation about Median, Standard Deviation and Coefficient of Variation.
Question 6.
Answer:
(i) Coefficient of Range(a) Wheat
The coefficient of variation is more reliable than all other measures.
Question 7.
Which batsman should be selected if we want,
(i) a higher run-getter, or
(ii) a more reliable batsman in the team?
Answer:
Batsman X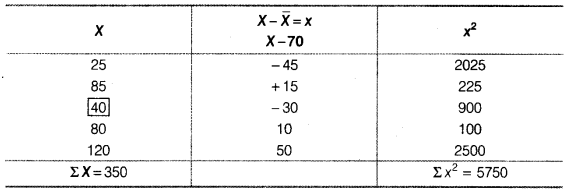
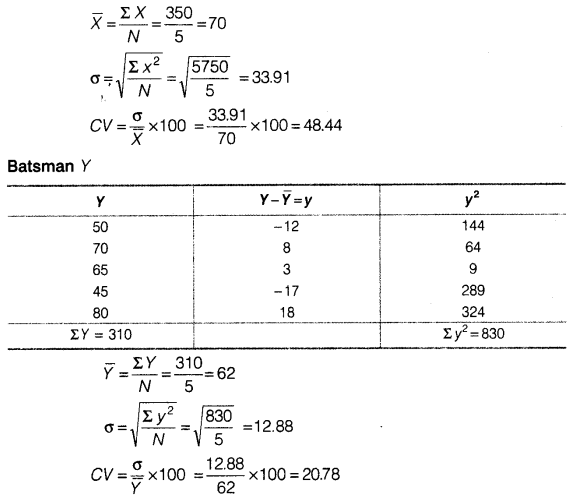
(i) Average of Batsman X is higher than that of Batsman Y, so he should be selected if we want a high scorer.
(ii) The Batsman Y is more reliable than Batsman X. This is because the coefficient of variation of Batsman X is higher than that of Batsman Y.
Question 8.
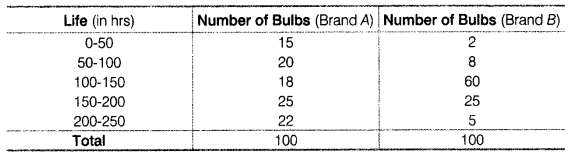
(i) Which brand gives higher life?
(ii) Which brand is more dependable?
Answer:
For Brand A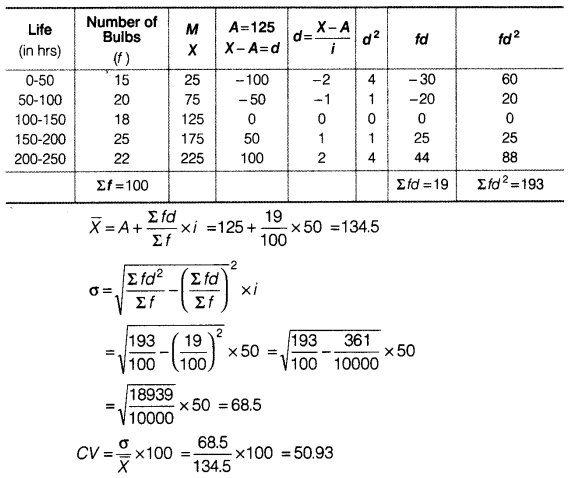
For Brand B
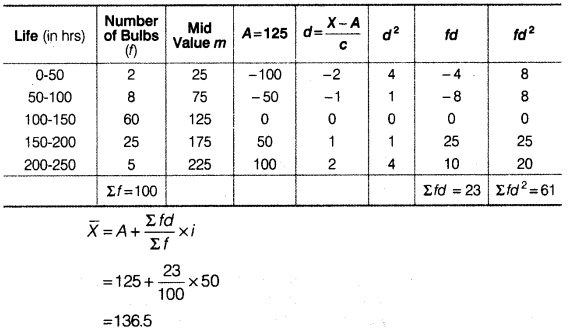
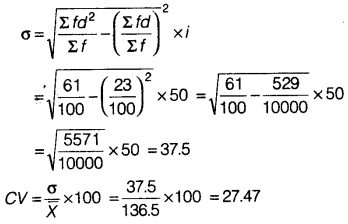
(i) The average life of bulb of Brand B is comparatively higher than that of Brand A.
(ii) The bulbs of Brand B are more dependable as CV of Brand B is lesser than CV of Brand A.
Question 9.
Answer:
N = 50\(\overline{x}\) = 200
σ = 40
Average wage = \(\frac{\text { Total wages }}{\text { Number of workers }}\)
200 = \(\frac{\text { Total wages }}{50}\)
So, total wages = 200 × 50 = ₹ 10,000
Now, increase in wage rate = ₹20
Total raise = 50 × 20= ₹ 1,000
Total wage after raise = ₹ 10,000 + 1,000 = ₹ 11,000
New average wage = \(\frac{\text { New total wages }}{\text { Number of workers }}=\frac{11,000}{50}\) = ₹220
Thus, Mean increases by the amount of increase in wage of each worker as the absolute increase was equal for all.
Standard Deviation will remain the same that is ₹40 as Standard Deviation is independent of origin and hence addition of equal amount in all the values will not cause any change in the Standard Deviation.
Uniformity of wages can be seen by coefficient of variation.
Previously, the coefficient of variation was
CV = \(\frac{\sigma}{\overline{X}} \times 100\) = (40/200) × 100 = 20
The new coefficient of variation after wage increase is given by
CV = \(\frac{\sigma}{x} \times 100\) = (40/220) × 100 = 18.18
This shows that wages have become more uniform now as the new CV is lower.
Question 10.
Answer:
Average wage = ₹ 200Hike in wages = 10%
Since arithmetic mean is not independent of scale, the mean will also increase by 10%.
= \(\frac{10}{100} \times 200\) = ₹ 20
Hence, the new Mean will be
200 + 20 = ₹ 220
Standard Deviation is also not independent of scale, hence, the Standard Deviation will also increase by 10% Initial Standard Deviation = ₹ 40
So, New Standard Deviation = ₹40 +10% of 40
= ₹ (40 + 4)
= ₹ 44
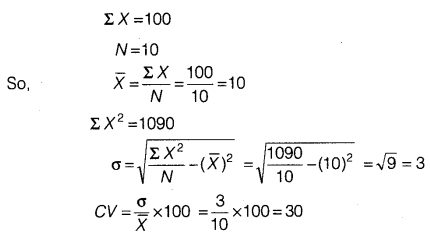
Question 11.
Answer:
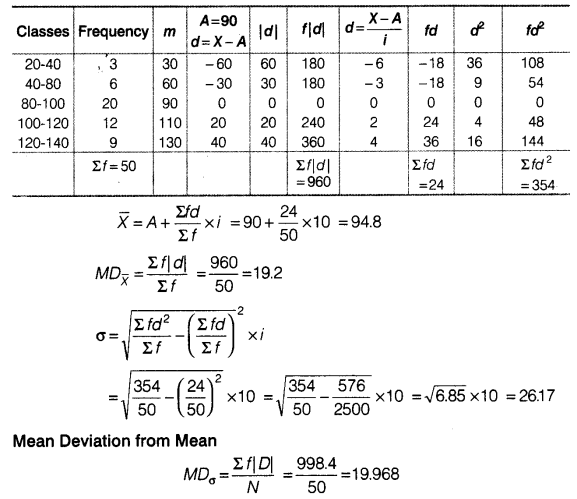
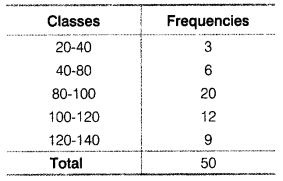
Question 12.
Answer:
NCERT Class 11 Economics Statistics for Economics
Class 11 Economics Chapters | Economics Class 11 Chapter 6
Chapterwise Indian Economic Development Class 11 NCERT Solutions
-
NCERT Solutions For Class 11 Economics Chapter 1 Indian economy on the Eve of Independence
NCERT Solutions For Class 11 Economics Chapter 2 Indian Economy (1950 – 1990)
NCERT Solutions For Class 11 Economics Chapter 3 Liberalisation, Privatisation and Globalisation: An Appraisal
NCERT Solutions For Class 11 Economics Chapter 4 Poverty
NCERT Solutions For Class 11 Economics Chapter 5 Human Capital Formation In India
NCERT Solutions For Class 11 Economics Chapter 6 Rural Development
NCERT Solutions For Class 11 Economics Chapter 7 Employment Growth, Informalisation and Other Issues
NCERT Solutions For Class 11 Economics Chapter 8 Infrastructure
NCERT Solutions For Class 11 Economics Chapter 9 Environment and Sustainable Development
NCERT Solutions For Class 11 Economics Chapter 10 Comparative development Experiences Of India and Its Neighbors
Chapterwise Statistics for Economics Class 11 NCERT Solutions
-
NCERT Solutions For Class 11 Economics Chapter 1 Introduction
NCERT Solutions For Class 11 Economics Chapter 2 Collection of Data
NCERT Solutions For Class 11 Economics Chapter 3 Organisation of Data
NCERT Solutions For Class 11 Economics Chapter 4 Presentation of Data
NCERT Solutions For Class 11 Economics Chapter 5 Measures of Central Tendency
NCERT Solutions For Class 11 Economics Chapter 6 Measures of Dispersion
NCERT Solutions For Class 11 Economics Chapter 7 Correlation
NCERT Solutions For Class 11 Economics Chapter 8 Index Numbers
Post a Comment
इस पेज / वेबसाइट की त्रुटियों / गलतियों को यहाँ दर्ज कीजिये
(Errors/mistakes on this page/website enter here)