
NCERT Solutions | Class 11 Economics Statistics for Economics Chapter 7 | Correlation

CBSE Solutions | Economics Class 11
Check the below NCERT Solutions for Class 11 Economics Statistics for Economics Chapter 7 Correlation Pdf free download. NCERT Solutions Class 11 Economics were prepared based on the latest exam pattern. We have Provided Correlation Class 11 Economics NCERT Solutions to help students understand the concept very well.
NCERT | Class 11 Economics Statistics for Economics
| Book: | National Council of Educational Research and Training (NCERT) |
|---|---|
| Board: | Central Board of Secondary Education (CBSE) |
| Class: | 11 |
| Subject: | Economics |
| Chapter: | 7 |
| Chapters Name: | Correlation |
| Medium: | English |
Correlation | Class 11 Economics | NCERT Books Solutions
You can refer to MCQ Questions for Class 11 Economics Statistics for Economics Chapter 7 Correlation to revise the concepts in the syllabus effectively and improve your chances of securing high marks in your board exams.
Statistics for Economics Class 11 NCERT Solutions Chapter 7 Correlation
Question 1.
(a) kg/feet
(b) percentage
(c) non-existent
Answer:
(c) Correlation coefficient (r) has no unit. It is a pure number. It meansss units of measurement are not part of r.Question 2.
(a) 0 to infinity
(b) minus one to plus one
(c) minus infinity to infinity
Answer:
(b) The value of the correlation coefficient lies between minus one and plus one, -1 ≤ r ≤ 1. If the value of r is outside this range it indicates error in calculation.Question 3.
(a) when Y increases X increases
(b) when Y decreases X increases
(c) when Y increases X does not change
Answer:
(a) If r is positive the two variables move in the same direction. e.g., when the price of coffee rises, the demand for tea also rises as coffee is a substitute of tea. Therefore, the r between price of coffee and demand for tea will be positive.Question 4.
(a) linearly related
(b) not linearly related
(c) independent
Answer:
(b) If rXY = 0, it means the two variables are uncorrelated and there is no linear relation between them. However, other types of relation may be there and they may not be independent.Question 5.
(a) Karl Pearson’s coefficient of correlation
(b) Spearman’s rank correlation
(c) Scatter diagram
Answer:
(c) The scatter diagram gives a visual presentation of the relationship and is not confined to linear relations. Karl Pearson’s coefficient of correlation and Spearman’s rank correlation are strictly the measures of linear relationship.Question 6.
(a) more accurate than rank correlation coefficient
(b) less accurate than rank correlation coefficient
(c) as accurate as the rank correlation coefficient
Answer:
(a) Rank correlation should be used only when the variables cannot be measured precisely, generally it is not as accurate as the simple correlation coefficient as all the information concerning the data is not utilised in this.Question 7.
Answer:
Both, correlation coefficient and covariance measure the degree of linear relationship between two variables, but correlation coefficient is generally preferred to covariance due to the following reasons- The correlation coefficient (r) has no unit.
- The correlation coefficient is independent of origin as well as scale.
Question 8.
Answer:
No the value of the correlation coefficient lies between minus one and plus one, -1 ≤ r ≤ 1. If the value of r is outside this range in any type of data, it indicates error in calculation.Question 9.
Answer:
No, correlation measures do not imply causation. Correlation measures co-variation and not causation.Correlation does not imply cause and effect relation. The knowledge of correlation only gives us an idea of the direction and intensity of change in a variable when the correlated variable changes. The presence of correlation between two variables X and Y simply means that when the value of one variable is found to change in one direction, the value of the other variable is found to change either in the same direction (i.epositive change) or in the opposite direction (i.e., negative change), in a definite way.
Question 10.
Answer:
Rank correlation is more precise than simple correlation coefficient in the following situations- When the Measurements of the Variables are Suspect e.g., in a remote village where measuring rods or weighing scales are not available, height and weight of people cannot be measured precisely but the people can be easily ranked in terms of height and weight.
- When Data is Qualitative It is difficult to quantify qualities such as fairness, honesty etc. Ranking may be a better alternative to quantification of qualities.
- When Data has Extreme Values Sometimes the correlation coefficient between two variables with extreme values may be quite different from the coefficient without the extreme values. Under these circumstances rank correlation provides a better alternative to simple correlation.
Question 11.
Answer:
No, zero correlation does not mean independence. If there is zero correlation (rXY = 0), it means the two variables are uncorrelated and there is no linear relation between them. However, other types of relation may be there and they may not be independent.Question 12.
Answer:
No, simple correlation coefficient can measure only linear relationship.Question 13.
Answer:
Accurate measurement is difficult in case of- Qualitative variables such as beauty, intelligence, honesty, etc.
- It is also difficult to measure subjective variables such as poverty, development, etc which are interpreted differently by different people.
Question 14.
Answer:
- If r = 0 the two variables are uncorrelated. There is no linear relation between them. However, other types of relation may be there and hence the variables may not be independent.
- If r= 1 the correlation is perfectly positive. The relation between them is exact in the sense that if one increases, the other also increases in the same proportion and if one decreases, the other also decreases in the same proportion.
- If r = -1 the correlation is perfectly negative. The relation between them is exact in the sense that if one increases, the other decreases in the same proportion and if one decreases, the other increases in the same proportion.
Question 15.
Answer:
Rank correlation coefficient differs from Pearsonian correlation coefficient in the following ways- Rank correlation coefficient is generally lower or equal to Karl Pearson’s coefficient.
- Rank correlation coefficient is preferred to measure the correlation between qualitative variables as these variables cannot be measured precisely.
- The rank correlation coefficient uses ranks instead of the full set of observations that leads to some loss of information.
- If extreme values are present in the data, then the rank correlation coefficient is more precise and reliable.
Question 16.

Answer:

Note Answer: printed in NCERT is incorrect.
Question 17.

Answer:
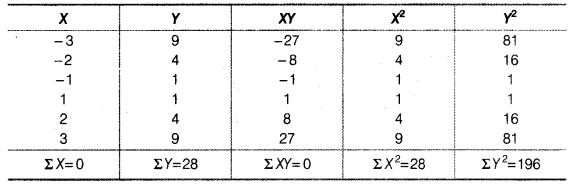
As the value of r is zero, so there is no linear correlation between X and Y.
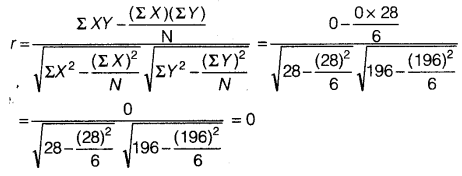
Question 18.

Solution
As the correlation coefficient between the two variables is + 1, so the two variables are perfectly positive correlated.
NCERT Class 11 Economics Statistics for Economics
Class 11 Economics Chapters | Economics Class 11 Chapter 7
Chapterwise Indian Economic Development Class 11 NCERT Solutions
-
NCERT Solutions For Class 11 Economics Chapter 1 Indian economy on the Eve of Independence
NCERT Solutions For Class 11 Economics Chapter 2 Indian Economy (1950 – 1990)
NCERT Solutions For Class 11 Economics Chapter 3 Liberalisation, Privatisation and Globalisation: An Appraisal
NCERT Solutions For Class 11 Economics Chapter 4 Poverty
NCERT Solutions For Class 11 Economics Chapter 5 Human Capital Formation In India
NCERT Solutions For Class 11 Economics Chapter 6 Rural Development
NCERT Solutions For Class 11 Economics Chapter 7 Employment Growth, Informalisation and Other Issues
NCERT Solutions For Class 11 Economics Chapter 8 Infrastructure
NCERT Solutions For Class 11 Economics Chapter 9 Environment and Sustainable Development
NCERT Solutions For Class 11 Economics Chapter 10 Comparative development Experiences Of India and Its Neighbors
Chapterwise Statistics for Economics Class 11 NCERT Solutions
-
NCERT Solutions For Class 11 Economics Chapter 1 Introduction
NCERT Solutions For Class 11 Economics Chapter 2 Collection of Data
NCERT Solutions For Class 11 Economics Chapter 3 Organisation of Data
NCERT Solutions For Class 11 Economics Chapter 4 Presentation of Data
NCERT Solutions For Class 11 Economics Chapter 5 Measures of Central Tendency
NCERT Solutions For Class 11 Economics Chapter 6 Measures of Dispersion
NCERT Solutions For Class 11 Economics Chapter 7 Correlation
NCERT Solutions For Class 11 Economics Chapter 8 Index Numbers
Post a Comment
इस पेज / वेबसाइट की त्रुटियों / गलतियों को यहाँ दर्ज कीजिये
(Errors/mistakes on this page/website enter here)