
NCERT Solutions | Class 7 Maths Chapter 3 | Data Handling

CBSE Solutions | Maths Class 7
Check the below NCERT Solutions for Class 7 Maths Chapter 3 Data Handling Pdf free download. NCERT Solutions Class 7 Maths were prepared based on the latest exam pattern. We have Provided Data Handling Class 7 Maths NCERT Solutions to help students understand the concept very well.
NCERT | Class 7 Maths
| Book: | National Council of Educational Research and Training (NCERT) |
|---|---|
| Board: | Central Board of Secondary Education (CBSE) |
| Class: | 7th |
| Subject: | Maths |
| Chapter: | 3 |
| Chapters Name: | Data Handling |
| Medium: | English |
Data Handling | Class 7 Maths | NCERT Books Solutions
NCERT Solutions for Class 7 Maths Chapte 3 Data Handling Exercise 3.1
Ex 3.1 Class 7 Maths Question 1.
Find the range of heights of any ten students of your class.Solution:
Let the heights (in cm) of 10 students in the class be 150, 152, 151, 148, 149, 149, 150, 152, 153, 146.Arranging the heights in ascending order, we have 146, 148, 149, 149, 150, 150, 151, 152, 152, 153.
Range of height of students = 153 – 146 = 7
Ex 3.1 Class 7 Maths Question 2.
Organise the following marks in a class assessment, in a tabular form.4, 6, 7, 5, 3, 5, 4, 5, 2, 6, 2, 5,1, 9, 6, 5, 8, 4, 6, 7
(i) Which number is the highest?
(ii) Which number is the lowest?
(iii) What is the range of the data?
(iv) Find the arithmetic mean.
Solution:
Arranging the marks in a class assessment in a tabular form :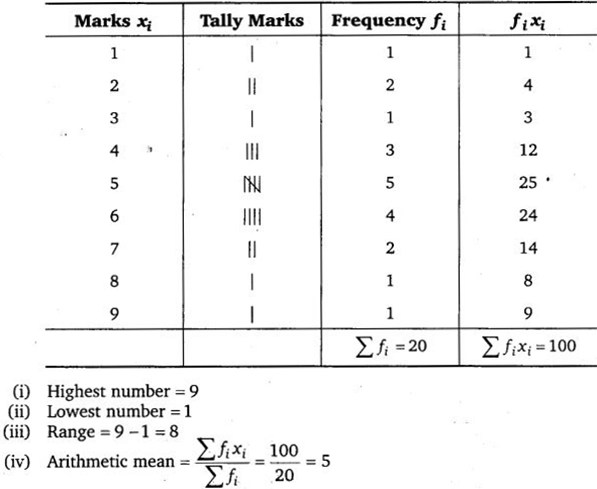
Ex 3.1 Class 7 Maths Question 3.
Find the mean of the first five whole numbers.Solution:
The first 5 whole numbers are 0, 1, 2, 3, 4Their mean = \(\frac { 0+1+2+3+4 }{ 5 }\) = \(\frac { 10 }{ 5 }\) = 2
Ex 3.1 Class 7 Maths Question 4.
A cricketer scores the following runs in eight innings: 58, 76,40, 35, 46, 45, 0,100. Find the mean score.Solution:
Total runs = 58 + 76 + 40 + 35 + 46 + 45 + 0 +100 = 400Number of observations = 8
∴ Mean = \(\frac { 400 }{ 8 }\) = 50
Ex 3.1 Class 7 Maths Question 5.
Following table shows the points of each player scored in four games :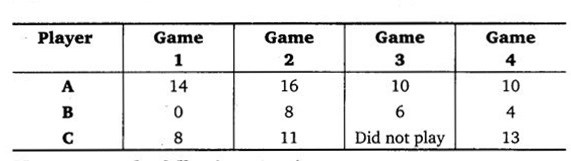
Now answer the following questions :
(i) Find the mean to determine A’s average number of points scored per game.
(ii) To find the mean number of points per game for C, would you divide the total points by 3 or by 4? Why?
(iii) B played in all four games. How would you find the mean?
(iv) Who is the best performer?
Solution:
(i) A’s average number of points scored per game \(\frac { 14+16+10+10 }{ 4 } \) = \(\frac { 50 }{ 4 } \) = 12.5(ii) C’s average points per game = \(\frac { 8+11+0+13 }{ 4 } \) = \(\frac { 32 }{ 4 } \) = 8
Since we are comparing the performance, so we divide by 4 to find the mean for C.
(iii) B’s average point per game = \(\frac { 0+8+6+4 }{ 4 } \) = \(\frac { 18 }{ 4 } \) = 4.5
(To find B’s average, we find the sum of all observations and divide this by the number of observations.)
(iv) Since, 12.5 > 8 > 4.5
∴ The best performer is A.
Ex 3.1 Class 7 Maths Question 6.
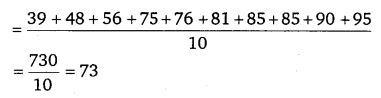
The marks (out of 100) obtained by a group of students in a science test are 85,76,90,85,39,48,56,95,81 and 75. Find the :(i) Highest and the lowest marks obtained by the students.
(ii) Range of the marks obtained.
(iii) Mean marks obtained by the group.
Solution:
Arranging the marks obtained by a group of students in ascending order, we have 39, 48, 56, 75, 76, 81, 85, 85, 90, and 95.(i) Highest and the lowest marks obtained are 95 and 39, respectively.
(ii) Range of the marks obtained = 95 – 39 =56
(iii) Mean marks
Ex 3.1 Class 7 Maths Question 7.
The enrolment in a school during six consecutive years was as follows: 1555, 1670, 1750, 2013, 2540, 2820.Find the mean enrolment of the school for this period.
Solution:
Sum of the enrolment during six consecutive years= 1555 + 1670 + 1750 + 2013 + 2540 + 2820
= 12348
Mean enrolment = \(\frac { 12348 }{ 6 } \) = 2058
Ex 3.1 Class 7 Maths Question 8.
The rainfall (in mm) in a city on 7 days of a certain week was recorded as follows :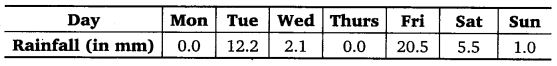
(i) Find the range of the rainfall in the above data.
(ii) Find the mean rainfall for the week.
(iii) On how many days was the rainfall less than the mean rainfall?
Solution:
(i) Arranging the rainfall during the week in ascending order,we have 0.0, 0.0, 1.0, 2.1, 5.5, 12.2, 20.5
Range = 20.5 – 0.0 = 20.5
(ii) Sum of the rainfall during the week = 0.0 + 0.0 + 1.0 + 2.1 + 5.5 + 12.2 + 20.5 = 41.3
Mean = \(\frac { 41.3 }{ 7 } \) = 5.9
(iii) For five days, the rainfall was less than the mean rainfall.
Ex 3.1 Class 7 Maths Question 9.
The heights of 10 girls were measured in cm and the results are as follows :135, 150, 139, 128, 151, 132, 146, 149, 143, 141.
(i) What is the height of the tallest girl?
(ii) What is the height of the shortest girl?
(iii) What is the range of the data?
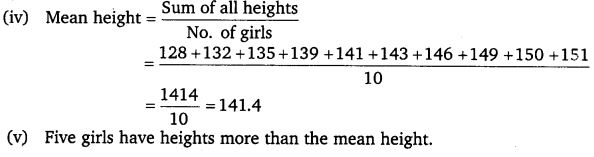
(iv) What is the mean height of the girls?
(v) How many girls have heights more than the mean height?
Solution:
Arranging the heights (in cm) in the ascending order, we have 128, 132, 135, 139, 141, 143, 146, 149, 150, 151.(i) Height of the tallest girl is 151 cm.
(ii) Height of the shortest girl is 128 cm.
(iii) Range = (151 – 128) cm = 23 cm.
(iv) Mean height of the girls = 141.4 cm
(v) 5 girls have heights more than the mean height.
NCERT Solutions for Class 7 Maths Chapte 3 Data Handling Exercise 3.2
Ex 3.2 Class 7 Maths Question 1.
The scores in mathematics test (out of 25) of 15 students is as follows :19, 25, 23, 20, 9, 20,15, 10, 5,16, 25, 20, 24, 12, 20
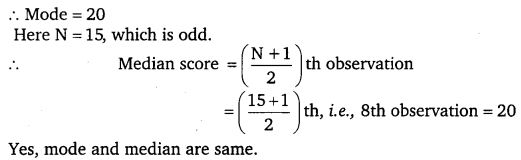
Find the mode and median of this data. Are they same?
Solution:
Arranging the scores in Mathematics in ascending order,we have 5, 9, 10, 12, 15, 16, 19, 20, 20, 20, 20, 23, 24, 25, 25.
Clearly, 20 occurs the maximum number of times.
Ex 3.2 Class 7 Maths Question 2.
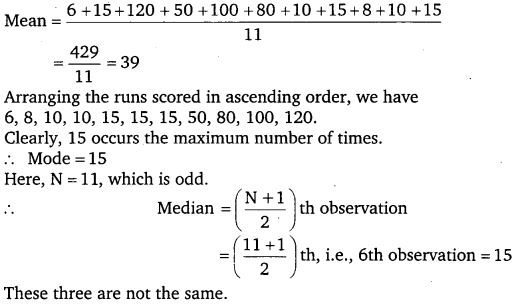
The runs scored in a cricket match by 11 players is as follows :6, 15, 120, 50, 100, 80, 10, 15, 8, 10,15
Find the mean, mode and median of this data. Are the three same?
Solution:
Ex 3.2 Class 7 Maths Question 3.
The weights (in kg) of 15 students of a class are :38, 42, 35, 37, 45, 50, 32, 43, 43, 40, 36, 38, 43, 38, 47
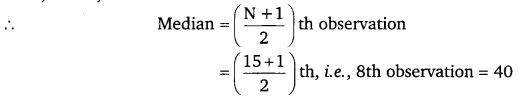
(i) Find the mode and median of this data.
(ii) Is there more than one mode?
Solution:
(i) Arranging the weights (in kg) in ascending order,we have 32, 35, 36, 37, 38, 38, 38, 40, 42, 43, 43, 43, 45, 47, 50.
Clearly, 38 and 43 occur the maximum number of times.
∴ Modes are 38 and 43.
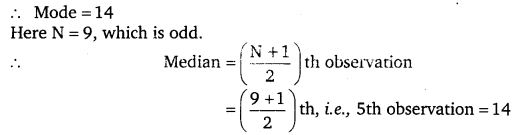
Here, N = 15, which is odd.
(ii) Yes, there are more than one mode.
Ex 3.2 Class 7 Maths Question 4.
Find the mode and median of the following data :13, 16, 12, 14, 19, 12, 14, 13, 14.
Solution:
Arranging the data in ascending order, we have12, 12, 13, 13, 14, 14, 14, 16, 19
Clearly, 14 occurs the maximum number of times.
Ex 3.2 Class 7 Maths Question 5.
Tell whether the statement is true or false :- The mode is always one of the numbers in a data.
- The mean is one of the numbers in a data.
- The median is always One of the numbers in a data.
- The data 6, 4, 3, 8, 9, 12, 13, 9 has mean 9.
Solution:
- True
- False
- True
- False
NCERT Solutions for Class 7 Maths Chapte 3 Data Handling Exercise 3.3
Ex 3.3 Class 7 Maths Question 1.
Use the bar graph to answer the following questions.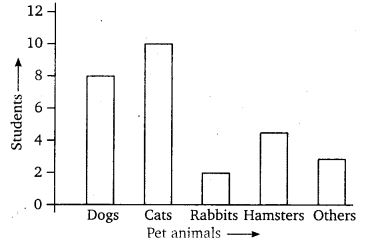
(a) Which is the most popular pet?
(b) How many students have dog as a pet?
Solution:
Clearly, from the given bar graph :
(a) The most popular pet is cat.
(b) Eight children have dog as a pet.
Ex 3.3 Class 7 Maths Question 2.
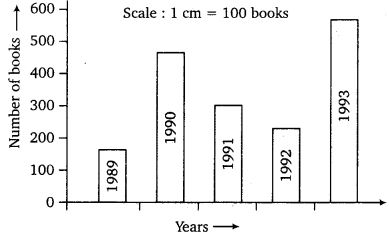
Read the bar graph which shows the number of books sold by a bookstore during five consecutive years and answer the following questions :(i) About how many books were sold in 1989? 1990? 1992?
(ii) In which year were about 475 books sold? About 225 books sold?
(iii) In which years were fewer than 250 books sold?
(iv) Can you explain how you would estimate the number of books sold in 1989?
Solution:
Clearly, from the given graph, we have(i) Number of books sold in the year
1989 : 170 (approx.)
1990 : 475 (approx.)
1992 : 225 (approx.)
(ii) In the year 1990, about 475 books were sold. In the year 1992, about 225 books were sold.
(iii) Fewer than 250 books were sold in the years 1989 and 1992.
(iv) It can be estimated using the height of the bar such that height of 1 cm = 100 books.
Ex 3.3 Class 7 Maths Question 3.
Number of children in six different classes are given below. Represent the data on a bar graph.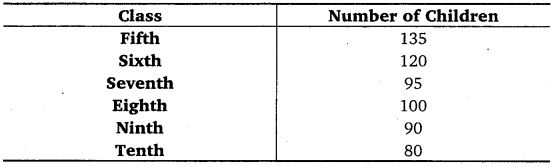
(a) How would you choose a scale?
(b) Answer the following questions :
(i) Which class has the maximum number of children? And the minimum?
(ii) Find the ratio of students of class sixth to the student of class eighth.
Solution:
(a) Start the scale at 0. The greatest value in the data is 135, so end the scale at a value greater than 135, such as 140. Use equal divisions along the axes, such as increments of 10. Here, we take 1 unit for 10 children. The bar graph is as under :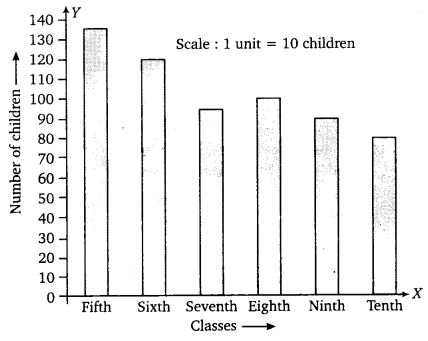
(b) (i) The fifth class has the maximum number of children. The minimum number of children are in class tenth.
(ii) Ratio of students of class sixth to eighth is 120 : 100 = 6 : 5.
Ex 3.3 Class 7 Maths Question 4.
The performance of a student in 1st Term and 2nd Term is given. Draw a double bar graph choosing appropriate scale and answer the following :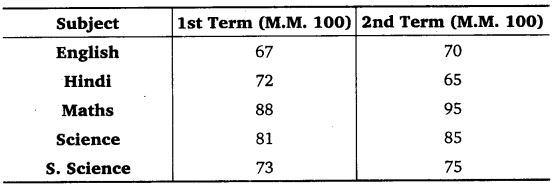
- In which subject has the child improved his performance the most?
- In which subject is the improvement the least?
- Has the performance gone down in any subject?
Solution:
The graph is as under :
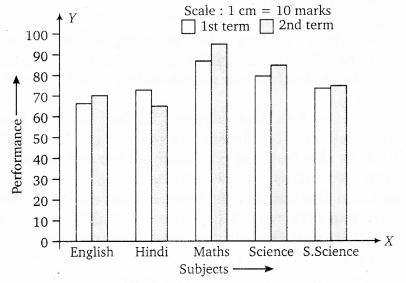
- In Mathematics the child has improved his performance the most.
- In Social Science the child has improved his performance the least.
- Yes, the performance has gone down in Hindi.
Ex 3.3 Class 7 Maths Question 5.
Consider this data collected from a survey of a colony.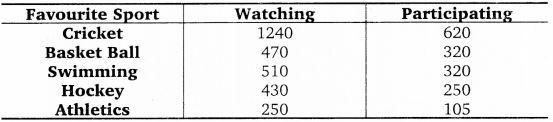
(i) Draw a double bar graph choosing an appropriate scale. What do you infer from the bar graph?
(ii) Which sport is most popular?
(iii) Which is more preferred, watching or participating in sports?
Solution:
(i) The graph is as under :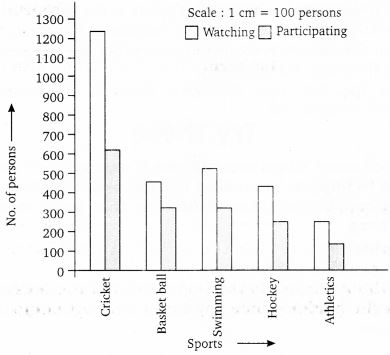
It is inferred that more people prefer cricket and less athletics.
(ii) Most popular sport is cricket.
(iii) Watching is more preferred than participating.
Ex 3.3 Class 7 Maths Question 6.
Take the data giving the minimum and the maximum temperature of various cities given in the beginning of this chapter. Plot a double bar graph using the data and answer the following :- Which city has the largest difference in the minimum and maximum temperature on the given date?
- Which is the hottest city and which is the coldest city?
- Name two cities where maximum temperature of one was less than the minimum temperature of the other.
- Name the city which has the least difference between its minimum and the maximum temperature.
Solution:
The graph is as under :
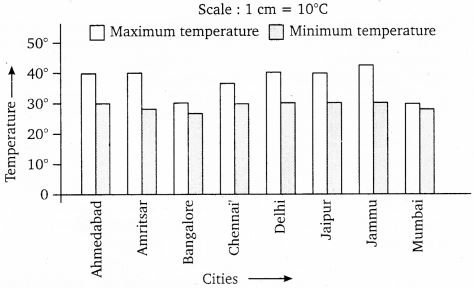
- The city Jammu has the largest difference in the minimum and maximum temperature on the given date.
- Jammu is the hottest city and Bangalore is the coldest city.
- The name of the two cities where maximum temperature of one was less than the minimum temperature of other are Bangalore and Jaipur or Bangalore and Ahmedabad.
- Mumbai has the least difference between its minimum and the maximum temperature.
NCERT Solutions for Class 7 Maths Chapte 3 Data Handling Exercise 3.4
Ex 3.4 Class 7 Maths Question 1.
Tell whether the following is certain to happen, impossible, can happen but not certain.- You are older today than yesterday.
- A tossed coin will land heads up.
- A die when tossed shall land up with 8 on top.
- The next traffic light seen will be green.
- Tomorrow will be a cloudy day.
Solution:
- Certain to happen
- Can happen but not certain
- Impossible
- Can happen but not certain
- Can happen but not certain
Ex 3.4 Class 7 Maths Question 2.
There are 6 marbles in a box with numbers from 1 to 6 marked on each of them.(i) What is the probability of drawing a marble with number 2 ?
(ii) What is the probability of drawing a marble with number 5 ?
Solution:
Out of 6 marbles, one can be drawn in 6 ways. So, total number of events = 6(i) The marble with number 2 can be obtained only in one way.
∴ Required probability = \(\frac { 1 }{ 6 } \)
(ii) The marble with number 5 can be obtained only in one way.
∴ Required probability = \(\frac { 1 }{ 6 } \)
Ex 3.4 Class 7 Maths Question 3.
A coin is flipped to decide which team starts the game. What is the probability that your team will start?Solution:
On tossing of a coin, the possible outcomes are head (H) or tail (T).Required probability = \(\frac { 1 }{ 2 } \)
NCERT Class 7 Maths
Class 7 Maths Chapters | Maths Class 7 Chapter 3
NCERT Solutions for Class 7 Maths
NCERT Solutions of Maths Class 7 Chapter-wise
Chapter-wise NCERT Solutions for Class 7 Maths
-
NCERT Solutions For Class 7 Maths Chapter 1 Integers
NCERT Solutions For Class 7 Maths Chapter 2 Fractions and Decimals
NCERT Solutions For Class 7 Maths Chapter 3 Data Handling
NCERT Solutions For Class 7 Maths Chapter 4 Simple Equations
NCERT Solutions For Class 7 Maths Chapter 5 Lines and Angles
NCERT Solutions For Class 7 Maths Chapter 6 The Triangles and its Properties
NCERT Solutions For Class 7 Maths Chapter 7 Congruence of Triangles
NCERT Solutions For Class 7 Maths Chapter 8 Comparing Quantities
NCERT Solutions For Class 7 Maths Chapter 9 Rational Numbers
NCERT Solutions For Class 7 Maths Chapter 10 Practical Geometry
NCERT Solutions For Class 7 Maths Chapter 11 Perimeter and Area
NCERT Solutions For Class 7 Maths Chapter 12 Algebraic Expressions
NCERT Solutions For Class 7 Maths Chapter 13 Exponents and Powers
NCERT Solutions For Class 7 Maths Chapter 14 Symmetry
NCERT Solutions For Class 7 Maths Chapter 15 Visualising Solid Shapes
NCERT Solutions for Class 6 to 12
-
NCERT Solutions for Class 6 All Subjects
NCERT Solutions for Class 7 All Subjects
NCERT Solutions for Class 8 All Subjects
NCERT Solutions for Class 9 All Subjects
NCERT Solutions for Class 10 All Subjects
NCERT Solutions for Class 11 All Subjects
NCERT Solutions for Class 12 All Subjects
Post a Comment
इस पेज / वेबसाइट की त्रुटियों / गलतियों को यहाँ दर्ज कीजिये
(Errors/mistakes on this page/website enter here)